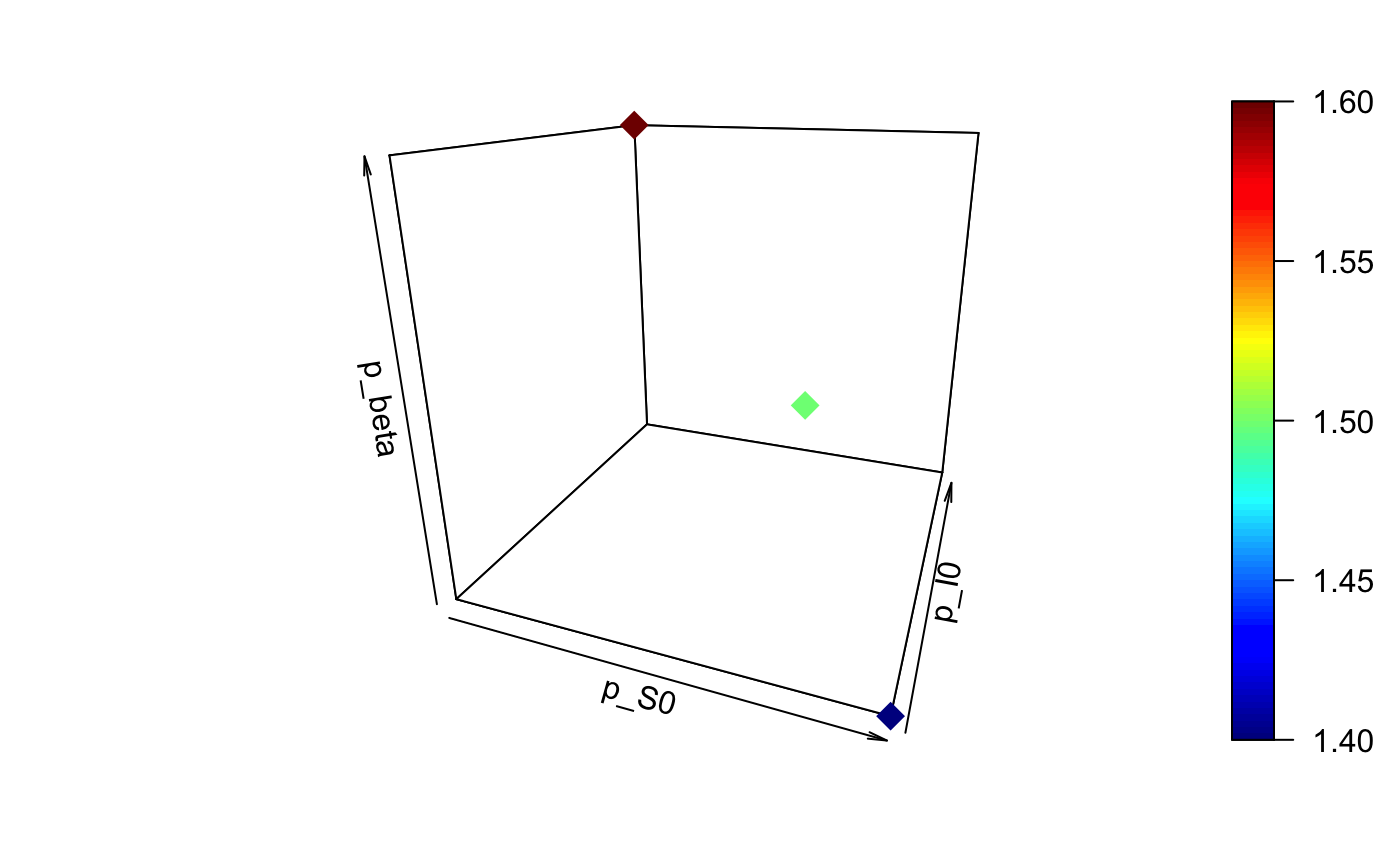
Plot the parameters that have the greatest variance in the experiments of a model.
plot_params(exp)
Arguments
| exp | An object of class |
|---|
Value
Returns a vector of the variables with highest variances.
Details
From the list of all parameters of the experiments that do vary (i.e. not null) the one (up to 3) with the biggest variance are ploted in 3D, 2D and 1D.
Examples
df <- data.frame(S0 = c(900, 800, 500), # this is a data frame of 3 lines I0 = c(100, 200, 500), R0 = 0, beta = c(1.4, 1.5, 1.6), gamma = .15, S = c(1, 2, 3), I = c(2, 4, 6), R = c(10, 20, 30), nbiter = 1000, seed = 123456789) exp0 <- as_experiment(df, parameters = c("S0", "I0", "R0", "beta", "gamma"), obsrates = c("S", "I", "R"), tmax = "nbiter", seed = "seed", experiment = "sir", model = system.file("models", "sir.gaml", package = "rama"))#> Periods of observation ("obsrates") are converted into integers.#>#> Final time step ("tmax") is converted into integer.#>#> Parameters' types are cast according to model definition#>plot_params(exp0)#> [1] 1 2 4
