# install and load the package
#install.packages("devtools")
#devtools::install_github("r-and-gama/rama")
library(rama)
#> Welcome to rama v0.0.1!
#> GAMA platform needs to be installed on your machine.
#> See http://www.gama-platform.org for more instructions about GAMA.
#> -- note that GAMA platform was found at /Applications/Gama.app
#> Gama configuration succeed!

# if necessary to configure GAMA path
# defpath("/Applications/Gama.app")
# Load the experiment "sir" from the definition of the model sir.gaml
exp <- load_experiment("sir",
system.file("models", "sir.gaml", package = "rama"))
#> Loading experiment "sir" from file "sir.gaml"...
#>
#> Periods of observation ("obsrates") are converted into integers.
#>
#> Final time step ("tmax") is converted into integer.
#>
#> Seed is converted into numeric.
#>
#> Parameters' types are cast according to model definition
#>
exp
#> Experiment with 1 simulation of 5 parameters and 3 observed variables
#> experiment name: sir
#> input gaml file: /Library/Frameworks/R.framework/Versions/3.5/Resources/library/rama/models/sir.gaml
#> model parameters: p_S0, p_I0, p_R0, p_beta, p_gamma
#> observed variables: r_S, r_I, r_R
#> Experiment overview:
#> p_S0 p_I0 p_R0 p_beta p_gamma r_S r_I r_R tmax seed output
#> 1 999 1 0 1.5 0.15 1 1 1 1000 1 NA# Define a first type of experiments on SIR having the same initial value
# called expA with S0=950, I0=50 and R0=0
exp$p_S0 <- 950L
exp$p_I0 <- 50L
exp$p_R0 <- 0L
# ... and with 100 steps and a frame rate of 1 for the images of the
# susceptibles
exp$tmax <- 100L
exp$r_S <- 1L
# Define a two experiments on this model
exp <- repl(exp, 2)
exp$p_beta <- c(0.3, 0.5)
exp$p_gamma <- 0.1# Execute all the experiments in the plan
out <- run_experiment(exp, hpc = 2)
#> Running experiment plan...
out
#> Experiment with 2 simulations of 5 parameters and 3 observed variables
#> experiment name: sir
#> input gaml file: /Library/Frameworks/R.framework/Versions/3.5/Resources/library/rama/models/sir.gaml
#> model parameters: p_S0, p_I0, p_R0, p_beta, p_gamma
#> observed variables: r_S, r_I, r_R
#> Experiment overview:
#> p_S0 p_I0 p_R0 p_beta p_gamma r_S r_I r_R tmax seed output
#> 1 950 50 0 0.3 0.1 1 1 1 100 1 <data.frame[100,4]>
#> 2 950 50 0 0.5 0.1 1 1 1 100 1 <data.frame[100,4]># Visualize the number of infected for the two experiments
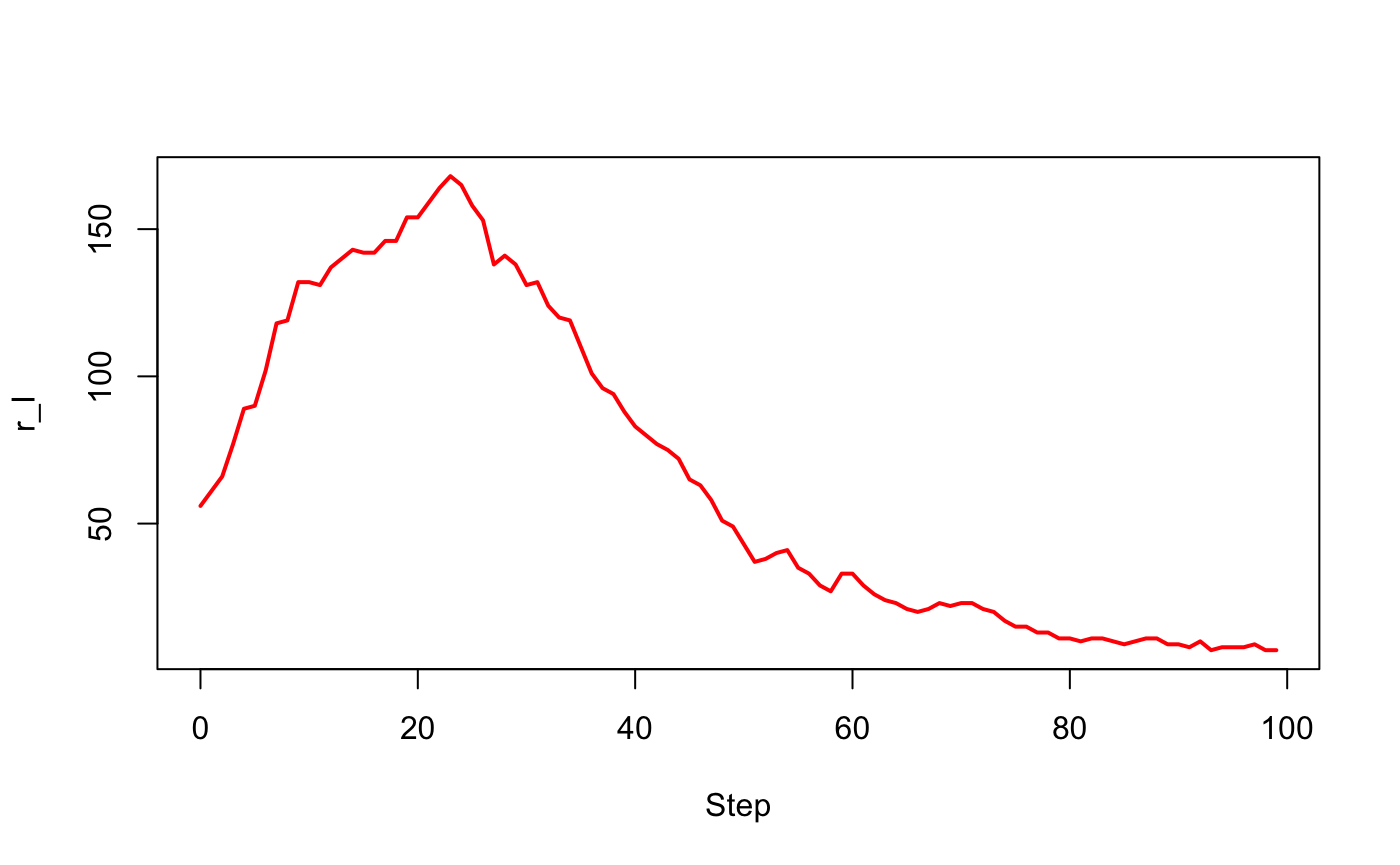
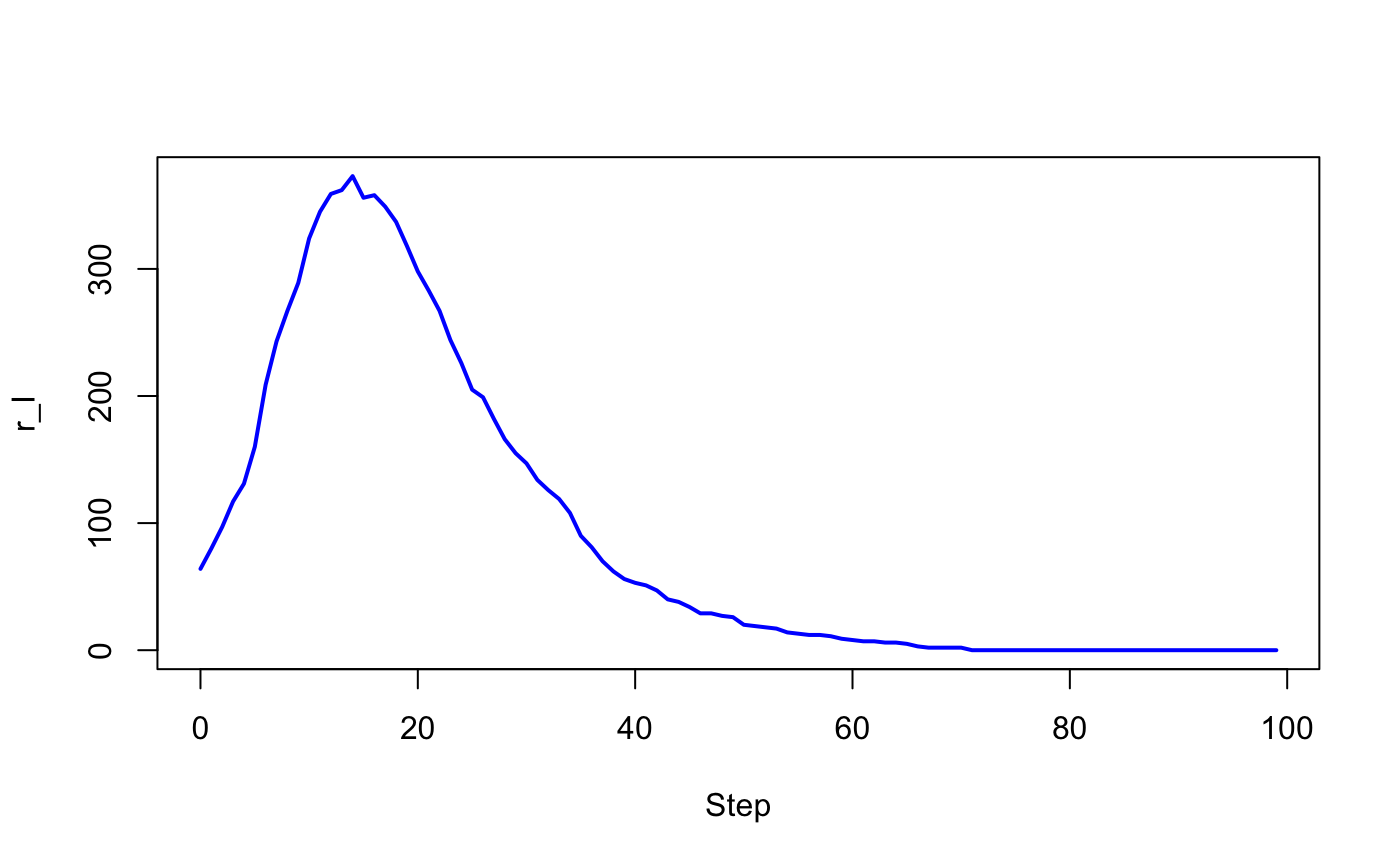
with(out$output[[1]], plot(Step, r_I, type = "l", lwd = 2, col = "red"))
